
CPU go Brrrrr..
Optimizing some terrible code.

A few weeks ago we wrote some code (https://fffej.substack.com/p/neural-networks) to explore neural networks. The code was written to try and be clear, but boy was it slow. In this post, we’ll see if we can make the CPU go brrrrr. And then we’ll conclude with some obvious statements about profiling1 🙂
Constraints
We’re going to focus on making the existing code faster, so we’ll completely ignore all the opportunities to make the algorithm itself faster. For example, we won’t use adaptive gradient descent (ADAM), even though this would mean it would converge faster.
Other arbitrary restrictions include not using multiple threads. I just want to max out a single core rather than worrying about concurrency - at least not yet!
Benchmarking
Measure twice, cut once. I could make some educated guesses as to why its slow, but without a way to measure it, I’ll just be fumbling in the dark. We need a way to understand how long each iteration takes. This is surprisingly hard with compiler optimizations, different tiers of JIT compiled code, runtime optimizations (etc).
Benchmark.Net is a super cool package that does all the hard work for me, at least once I have an isolated component that I hope behaves the same as the real application. I write the code I want to profile, slap an attribute on it and away we go. I’ll create two benchmark scenarios. In the first one, we’ll do the XOR training and in the second one, we’ll run a single iteration of the MNIST training set. Here’s the code and the results that we get from benchmarking (apologies for the formatting - if you cut and paste it into something that expands it’ll make more sense).
| Method                | Mean              | Error           | StdDev          | Gen0         | Gen1         | Allocated       |
|---------------------- |------------------:|----------------:|----------------:|-------------:|-------------:|----------------:|
| XOR_SingleIteration   |          2.462 μs |       0.0297 μs |       0.0263 μs |       0.7935 |            - |           13 KB |
| MNIST_SingleIteration | 12,178,798.764 μs | 232,643.1352 μs | 636,856.8282 μs | 9253000.0000 | 4626000.0000 | 151159688.22 KB |
Should we be able to go faster?
Before we go off and work out where it is slow, let’s take a step back and work out how fast it should be.
With the MNIST set, I’ve got 784 inputs, 50 hidden nodes, and 10 outputs, and I’m going to do all of this for 60000 bits of input. Multiply this all together and it’s off the order of 2.5 billion calculations (multiply and adds) for a whole bunch of double.
How long should a computer take to do 2.5 billion calculations? The answer is not long, and it’s certainly not 12 seconds! This benchmark suggests 0.1TFLOPS/s on LINPACK. If that were true, we should be able to get these calculations down to the millisecond range (that’s probably using all the cores, but it’s at least in the right ballpark). It’s certainly NOT reasonable for calculations to take 12 seconds so it’s right for us to try and do some optimization.
These “back of a fag packet” style estimates are always worthwhile in my opinion. If you don’t have a rough mental model of what fast is, then how would you know when to stop?
Is it reasonable to allocate 150GB? You know the answer to that, it’s just plain dumb. Before we try and get clever about what to optimize, let’s eliminate the stupid.
You’re allocating how much memory?
If you look at the MNIST_SingleIteration results as well as being slow you’ll notice big numbers in Gen0, Gen1 and Allocated. The GenX column contains the number of garbage collection events per 1000 options. The Allocated bit says we’ve allocated (during a single run!) about 150GB of memory. This isn’t the double[][] array for the training data as that’s not part of the benchmark. This is literally just 150GB of garbage allocated during a single training run.
If we go hunting around the code we can find some likely targets. We’re allocating Vector all over the place, especially with the operator overloading. We’ll fix that by pre-allocating Vector wherever possible and avoiding creating new vectors willy-nilly.
We end up with code like this all over the place:
    public void Backpropagate(Vector inputs, Vector errors, Vector outputErrors, double learningRate)
    {
        // Clear output errors first
        outputErrors.Zero();

        for (int i = 0; i < _neurons.Length; i++)
        {
            _neurons[i].Backpropagate(inputs, errors[i], _neuronErrors, learningRate);
            outputErrors.AddInPlace(_neuronErrors);
        }
    }
Instead of returning a value (outputErrors), we’re writing to it in place and thus avoiding allocating a new vector. You can see the full code here.
We’ll avoid any discussion of the ugliness of this approach, but is it worth it from a performance perspective? Let’s run our benchmarking tool again.
| Method                | Mean               | Error            | StdDev           | Allocated |
|---------------------- |-------------------:|-----------------:|-----------------:|----------:|
| XOR_SingleIteration   |           416.1 ns |          3.55 ns |          3.32 ns |         - |
| MNIST_SingleIteration | 4,845,556,367.1 ns | 48,971,577.84 ns | 45,808,044.30 ns |     400 B |
So that’s a chunky improvement. No longer are we allocating 150GB and as an added bonus we’ve got a chunky speed improvement (the unit has shifted from micro to nanoseconds - definitely the right direction).
That’s stage 1 complete. We’re not doing anything batshit crazy now.
So, where is it slow?
Our next challenge is to work out where things are slow. Benchmarking helps us take stock, but we want a more in-depth trace to find out where to point our optimizer muscles. Again, you could guess but you’ll probably be wrong. We want evidence. We’ll use the dotnet-trace tool to run a single iteration of the MNist training set. We’ll set the output for the right format to use speedscope.app.
dotnet-trace collect --format speedscope --launch-child-process -- dotnet back-prop.dll mnist
SpeedScope gives you this flame graph style view below, which breaks down execution into little slices.
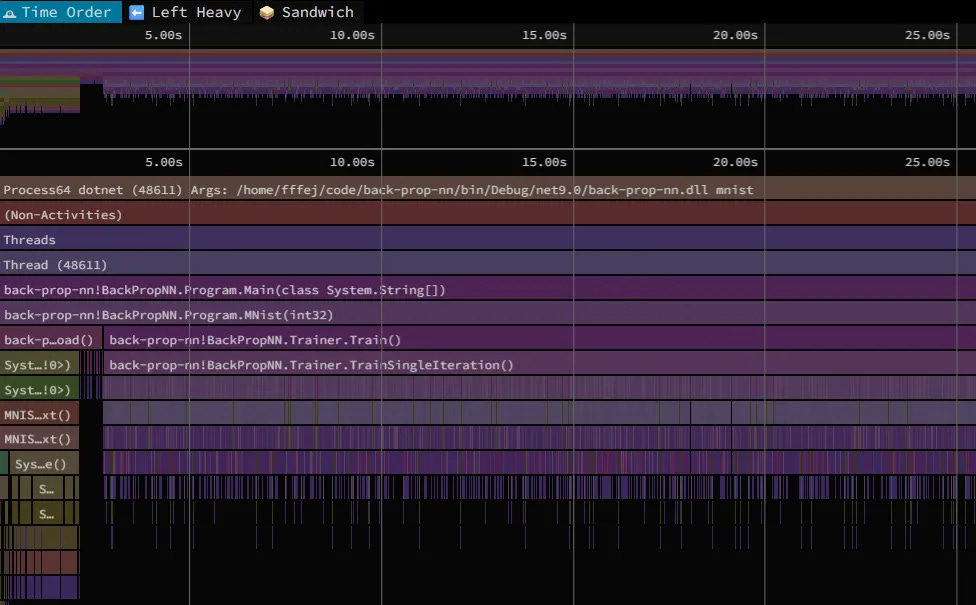
In the default view we can see the lifetime of the program. The TrainSingleIteration is where the most work happens, and if we switch to the “Left Heavy” view we can start to see where the time is spent (I’ll ignore the other bit, since it’s a one-off loading the input from disk).

So, most of the time (roughly three quarters) in TrainSingleIteration is spent in back propagation. And of that time, is in the method that does this:
        double sigmoidDeriv = SigmoidDerivative(_lastOutput);
        double delta = error * sigmoidDeriv;

        for (int i = 0; i < _weights.Length; i++)
            errors[i] = _weights[i] * delta;

        for (int i = 0; i < _weights.Length; i++)
            _weights[i] += learningRate * delta * inputs[i];

        _bias += learningRate * delta;
If we dig in a bit further, we can see that SigmoidDerivative doesn’t account for any appreciable time whatsoever so all we’re left with being able to make faster is the multiplication and addition.
Speeding up operations
So, what can we do to speed that up? I mean we could pull out the constant (learningRate * delta), but I imagine the compiler is smart enough to do that for us2.
We do a whole bunch of indexing operations, and each one of those ends up doing a bound-check operation. We can eliminate those. We can see this in the profiling stack as Vector.get_Item and Vector.get_Length(). They take approximately just over 5% of the time.

In 2017, .NET introduced Span<T> . One of the cool things using Span can enable is the removal of the bounds checking. So let’s change the code adding the ability to view the underlying array as a span, and sprinkle that liberally over the codebase as required.
| Method                | Mean               | Error            | StdDev            | Allocated |
|---------------------- |-------------------:|-----------------:|------------------:|----------:|
| XOR_SingleIteration   |           333.0 ns |          5.23 ns |           4.37 ns |         - |
| MNIST_SingleIteration | 4,110,351,987.7 ns | 81,670,414.09 ns | 187,651,357.96 ns |     400 B |
That’s a handy 20-25% speed boost for not doing much (see code). Why is it much more than the 5%? I could make some grand hypothesis about why this is (eliminating a method call means more time in hot loops?), but really, we should dig deeper if we wanted to understand this more.
However, overall performance still sucks. Our estimate means we should still be aiming to get a much bigger speed boost. Most of the code applies a single instruction to multiple bits of data (SIMD!). On my machine System.Numerics.Vector<double>.Count is four and this means for these operations we can do them four at a time.
The code’s a bit ugly, because we have to handle the case where we don’t have exactly a divisible number of 4.
    public void AddInPlace(ReadOnlySpan<double> other)
    {
        if (other.Length != Length)
            throw new ArgumentException("Span must be the same length for addition");

        var thisSpan = AsSpan();
        int vectorSize = Vector<double>.Count;
        int vectorizedLength = thisSpan.Length - (thisSpan.Length % vectorSize);

        for (int i = 0; i < vectorizedLength; i += vectorSize)
        {
            var v1 = new Vector<double>(thisSpan.Slice(i, vectorSize));
            var v2 = new Vector<double>(other.Slice(i, vectorSize));
            var result = v1 + v2;
            result.CopyTo(thisSpan.Slice(i, vectorSize));
        }

        // Handle remaining elements
        for (int i = vectorizedLength; i < thisSpan.Length; i++)
        {
            thisSpan[i] += other[i];
        }
    }
Given we’re just doing a whole bunch of multiplications and additions we should expect a roughly 4x speed improvement (though not quite because there’s some overhead setting it up). Here’s the link to the branch and here’s our new benchmark data.
| Method                | Mean               | Error            | StdDev           | Median             | Allocated |
|---------------------- |-------------------:|-----------------:|-----------------:|-------------------:|----------:|
| XOR_SingleIteration   |           432.9 ns |          7.41 ns |         14.28 ns |           426.5 ns |         - |
| MNIST_SingleIteration | 1,353,687,547.3 ns | 20,999,908.97 ns | 18,615,872.31 ns | 1,347,034,776.5 ns |     400 B |
Not bad - we’ve gone from 12 seconds an iteration to 1.3s. But still, even with no memory allocations and running SIMD on all the things, my CPU is still sat mostly idle. If we profile at this point, we just see a similar shape to before, but things are just shorter!
Can Claude help it go even faster?
I asked my friend Claude for some ideas, and they suggested using some unsafe code and who am I to disagree? (thankfully I’m armed with benchmarks and source control). The code is looking increasingly ugly, but is it faster?
| Method                | Mean             | Error           | StdDev          | Allocated |
|---------------------- |-----------------:|----------------:|----------------:|----------:|
| XOR_SingleIteration   |         435.3 ns |         3.78 ns |         3.54 ns |         - |
| MNIST_SingleIteration | 953,730,559.7 ns | 9,730,796.78 ns | 8,125,656.02 ns |     448 B |
More progress - we’re down to under a second for our 2.5 billion operations. We’ve definitely reaching the limit of my knowledge (and Claude’s!) of how we make this particular shape of problem go faster.
Optimizing for Memory Layout
Currently we’re using an array of structures (AoS). Each Neuron and Layer class has its own memory layout in its own space. All the numbers we need to multiply together are laid out non-contiguously in memory. Instead, we could use a structure of array (SoA), that’ll put everything next to each other in memory which will hopefully improve performance.
We’ll dispense with the Neuron class and any notion of objects, instead we’ll just shove everything into a single class.
class OptimizedLayer : Layer
{
    private readonly int _neuronCount;
    private readonly int _inputSize;

    // Structure-of-Arrays: All data of the same type stored together
    private readonly double[] _allWeights;    // All weights in one contiguous array
    private readonly double[] _allBiases;     // All biases in one contiguous array
    private readonly double[] _outputs;       // Pre-allocated outputs
    private readonly double[] _lastOutputs;   // For backpropagation (cached sigmoid outputs)

    // ... and so on
Here’s the code. Arguably it’s much simpler than what we started with originally (I suspect this is much more keeping with “A Philosophy of Software design” compared to the Clean Code style approach in the first one).
If we compare our two approaches, then does memory locality help?
| Method                          | Mean             | Error           | StdDev          | Allocated |
|-------------------------------- |-----------------:|----------------:|----------------:|----------:|
| XOR_SingleIteration             |         431.2 ns |         2.52 ns |         2.23 ns |         - |
| MNIST_SingleIteration           | 996,691,067.0 ns | 8,182,681.00 ns | 7,654,084.89 ns |     736 B |
| XOR_Optimized_SingleIteration   |         296.1 ns |         4.82 ns |         4.27 ns |         - |
| MNIST_Optimized_SingleIteration | 924,531,188.2 ns | 9,391,480.59 ns | 8,784,796.77 ns |     736 B |
It makes a comparatively large improvement on a single iteration of XOR (25% ish), but much less improvement (10%) on the larger task.
At this point, we’ve definitely reached the limits of how I think I can make this go faster. We’ve gone from 12 seconds to under a second which isn’t too shabby!
Conclusion
Optimization is fun. To move from fun to making progress, you should do all the obvious things you’ve heard thousands of times before.
Get an estimate of how much faster you can make things to see whether it’s worth it
Measure! Construct an experiment that’s representative of the thing you want to make faster.
Understand where you are spending time
But the real lesson here? Don’t try and do high-performance optimizations yourself (unless you’re in that game)! Just use torch (or ML.NET or some other package!) instead!
A big thank you for Clive Tong for proof reading this (mistakes are still mine!).
Here is a minimal example using Sharplab. L64 in the assembly looks like the hoisting to lift the constant out of the loop (don’t quote me on that as I’m not that confident…).