

Following on from my last post on Social and Organizational Heuristics, I thought I’d continue along in the same vein with some models from mathematics and information theory.
Math and information theory give us patterns for thinking about messy systems, perfect for diagnosing how we build software. You don’t have to get into the details either, these are high-level lens without a Greek letter in sight!
Fermi Estimation
Rough estimates fast.
Physicist Enrico Fermi was famous for back‑of‑the‑envelope estimates; at the Trinity test he famously dropped scraps of paper to gauge blast strength and got the order of magnitude right. There’s some other great examples from Tom Rocks Maths.

We’re wired to anchor on specifics, but without any sanity checks, precision is just confident guessing!
Some companies already recognize the need for rough estimates and use it in the interview process (or at least used to). In software, I find this useful to know when you’ve optimized enough or to compare the mental model of what you’ve imagine you’ve written versus what is actually happening! It has many other applications with software, such as using t-shirt sizing for estimates (rather than false precision) or using Fermi estimation to estimate your future cloud costs.
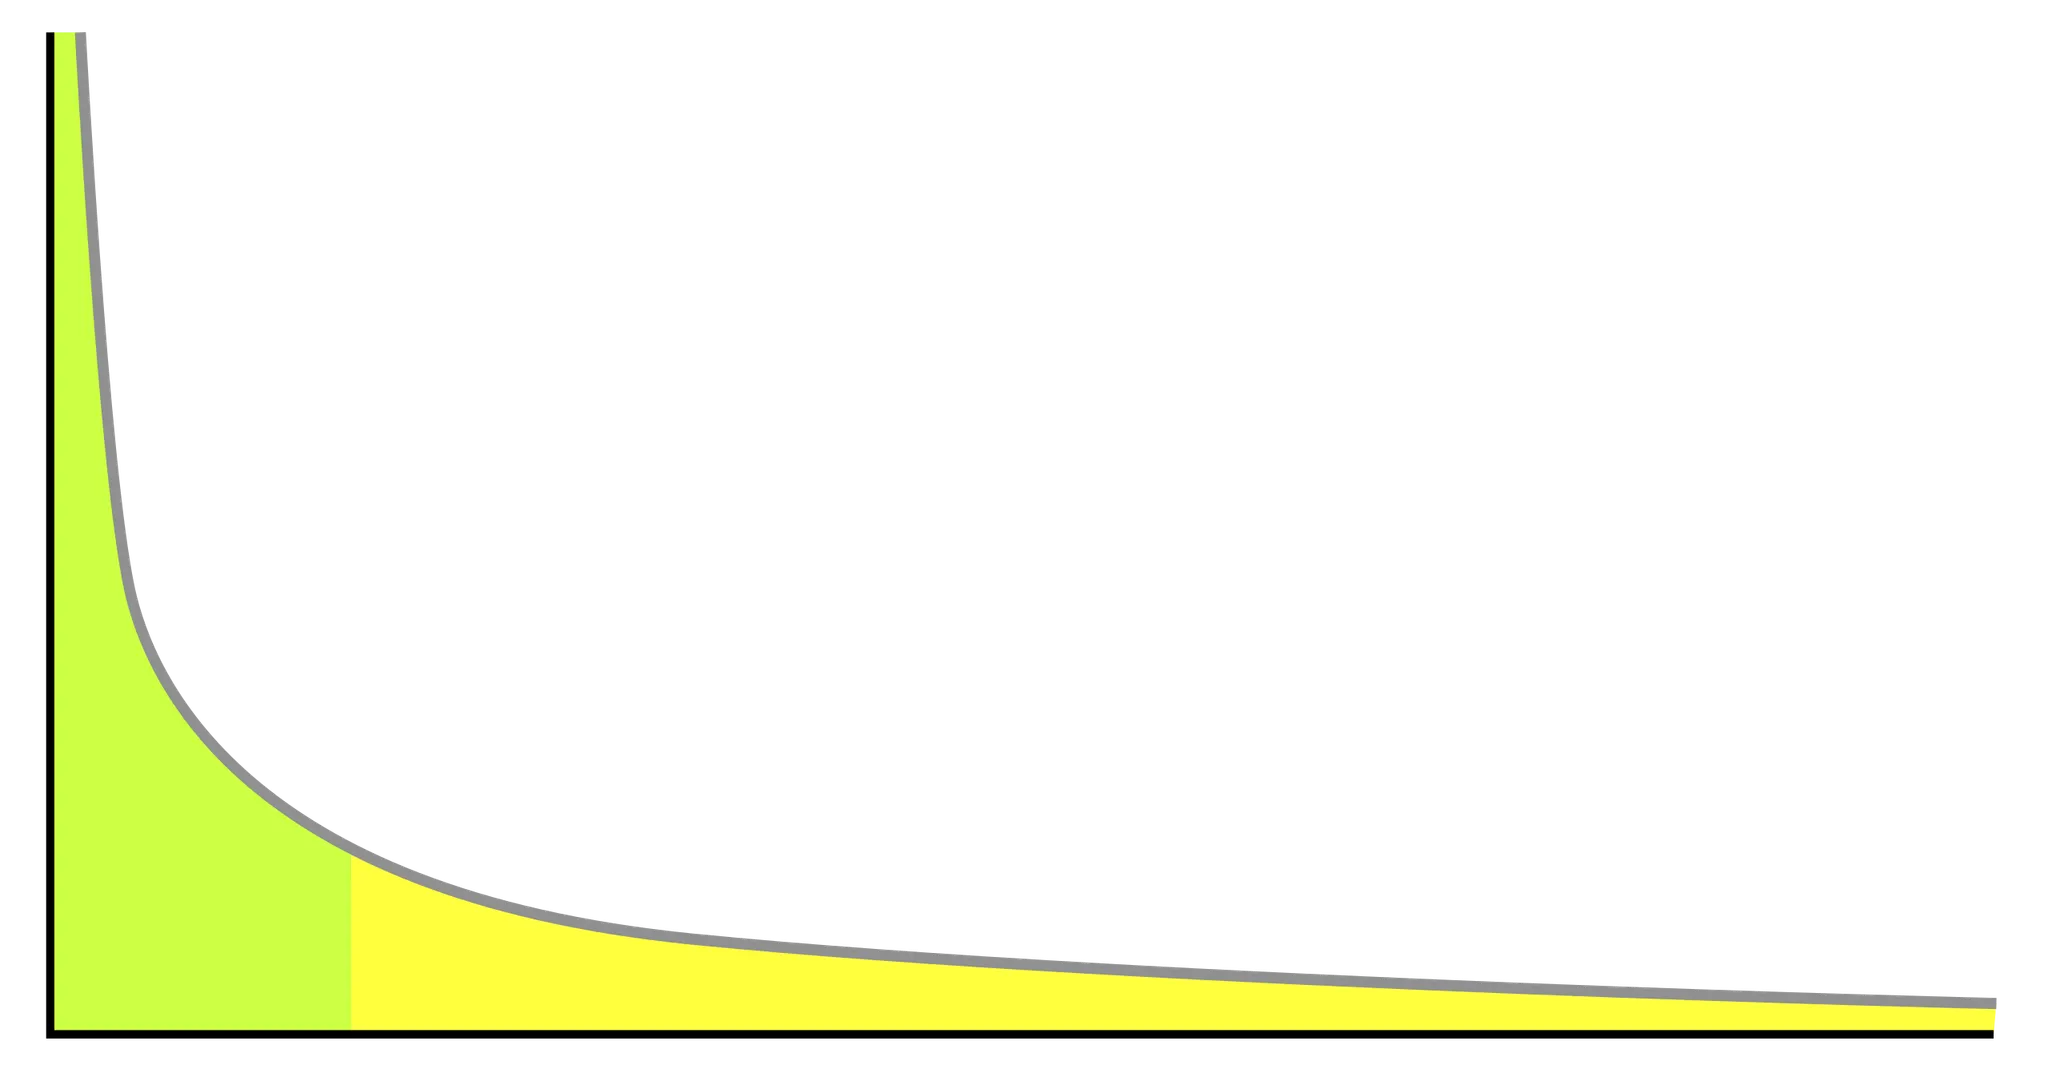
Power Laws & Tails
Value/defects can be concentrated in the tail
Many real systems are heavy‑tailed: a tiny fraction of events dominate totals. With a Gaussian distribution most values cluster around the mean and extremes are rare (think height of a human!). In comparison, with a power law distribution there’s typically many small events and a few huge ones. The tails are fat, meaning extreme events are far more common than a Gaussian distribution would fit. If you assume Gaussian but the reality is power law, you will massively underestimate the likelihood and impact of rare, extreme events.
In software, power law distributions are everywhere! A small number of files or modules account for most defects, and while most outages are minor, a few catastrophic incidents dominate downtime costs. Performance bottlenecks typically trace back to just a handful of functions or queries, and feature usage skews heavily toward a small core that gets constant use while most features are rarely touched. In many teams, a small group of contributors produces the bulk of commits, and although most pull requests merge quickly, a few drag on and block work disproportionately. CI pain is often concentrated in a handful of flaky tests, just as most exploitable security vulnerabilities lurk in a small set of components. Even code churn follows the pattern, with a few files being changed repeatedly while the rest remain stable.
You have to be on the watch for this constantly. If you treat a power law distribution in the wrong way, you’ll optimize the wrong thing! For example:
Optimize for percentiles, not means (P99!).
When thinking cost or performance, identify the “whale” endpoints/queries responsible
Expect a few features to drive most adoption and engagement and instrument to find them.
Pareto Front
With a multi-objective problem, you can’t improve one dimension without worsening another
Economist Vilfredo Pareto noticed that in multi-objective problems, you can’t improve one dimension without worsening another. The Pareto frontier is the set of options where no improvement can be made in one goal without sacrificing another. Everything inside the frontier is just worse in one dimension or another.
Imagine plotting candidate architectures on a graph where the x-axis represents latency (lower is better) and the y-axis represents monthly cost (again lower is better).
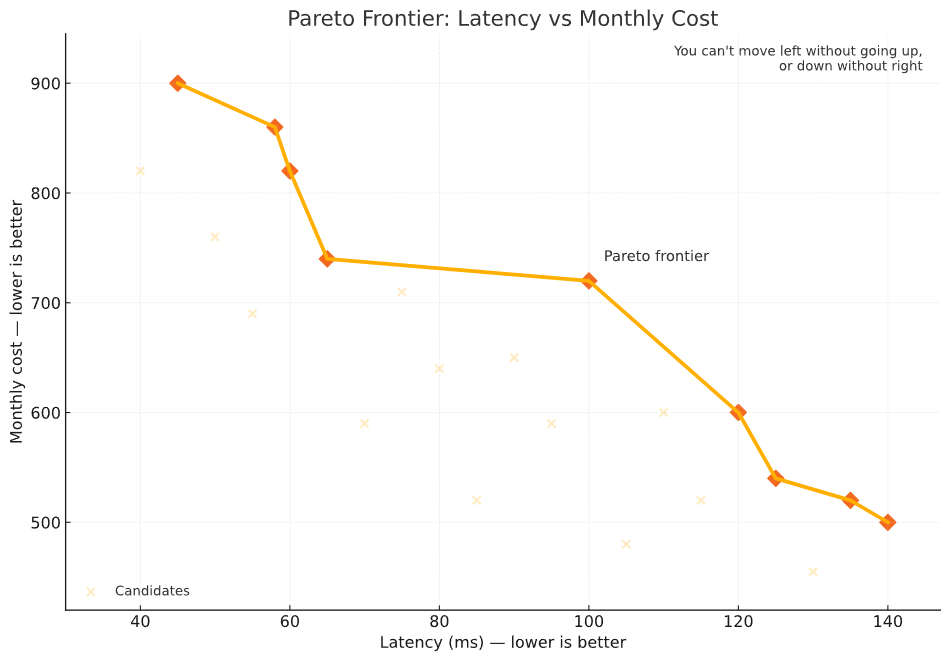
Each architecture is a point. The frontier is the line delineating where you can’t push further down or left without drifting up or right. Points away from the curve are strictly worse (paying more and cutting slower).
There’s many opportunities to put this into practice:
SLO vs. cost vs. latency: Plot candidate architectures; pick an intentional point.
Dev speed and production safety sit on different frontiers, tune separately.
With roadmaps, show leadership two or three frontier options, not a single “best.”
Tie SLAs/SLOs to the chosen point and avoid stealth gold‑plating.
The Base Rate
Best way to predict? See what you did before
Tversky & Kahneman showed we neglect priors (the base rate) when vivid stories distract us. Planning fallacy is a close cousin.
This is one of the most consequential cognitive biases. Some examples:
Your org has typically delivered projects in 9-12 months. You mistakenly assume this one will take three months because of a compelling presentation.
Analytics show that only 20% of of features in your product will get usage. You mistakenly assume that because “customers have been asking for it”, this feature is different!
How do you put this into action? Start with your own base rate. If you’re making forecasts, how long has it taken in the past? If you’re setting goals, what does the base rate give you?
OODA Loops
Observe, Orient, Decide, Act and repeat!
USAF Colonel John Boyd’s Observe–Orient–Decide–Act: advantage comes from running the loop faster than adversaries (or competitors, or entropy). Think of it as a fast run on the scientific method, observe with detail, orientate to work out whether your model matches the action, make an educated guess and what to do next, and then do it. Connect it all together with some feedback loops!
This is a super generic framework for interacting with almost any complicated system and applies across the whole software development life cycle.
Work in small chunks and get user feedback
Orient yourself by making sure you’ve got telemetry in place
Build feedback loops in (retrospectives, post mortems)
Optimize for speed of feedback (from compilation to user feedback and everything in between).
Schelling Points
Create common focal points
Thomas Schelling showed that people coordinate without talking by converging on “focal points”. For example, if I said to you let’s meet in Paris at noon with no other information, we’ll probably meet under the Eiffel Tower (especially if the objective of the game is for us to meet!).
If the default Git branch is always main and the README always explains setup in the first 10 lines, no one has to hunt or guess when they start a new project.
We’ve all watched teams flounder on silly things (tabs vs. spaces!). The more you can do to make the obvious thing the right thing, the better.
Use consistent naming everywhere - consistency makes the right the the easiest thing
Set appropriate defaults - Project templates, repo structures, CODEOWNERS, and folder layouts reduce negotiation.
Use rituals judiciously. ****Predefined roles/rooms/rituals, everyone knows where to show up.
Go with the flow. Embrace convention.
Simpson’s Paradox
Check the subgroups - aggregates can lie!
Simpson’s Paradox happens when a relationship between two variables reverses or vanishes once data from different groups is combined, often because a lurking variable is influencing the results. It’s a statistical trap that can make aggregated data tell the opposite story from the one told by the underlying subgroups. This can mislead decision-makers into drawing the wrong conclusions unless they dig into the data structure and understand the context
This basketball example, taken from https://www.mickmel.com/simpsons-paradox-can-make-sports-stats-look-weird/ illustrates it nicely:
In two point shots, Larry shot 50.9%, Reggie shot 51.6% (Reggie is better!)
In three point shots, Larry shot 37.6%, and Reggie shot 39.5% (Reggie is better again)
But when you add them together, Larry was the overall better shooter!
Lies, damned lies and statistics! Before you make assumptions about data, you have to understand it. If the aggregate is surprisingly good (or bad), ask yourself “could this be hiding a difference in the subgroups?”. This starts from designing a deliberate experiment with success criteria, and continues past that into interpreting the data. Segment the data - does it tell the same story consistently? Maybe the performance of frequently hit one-endpoint is masking slower performance at infrequently hit endpoints? Remember, check the subgroups as aggregates can lie!
Conclusion
In this post, I’ve just given more ways of looking at the world. The trick with mental models is to keep them handy and pull out the right one before you’ve convinced yourself you don’t need it!